# Trends
The Trends tab in Keitaro provides the information about the dynamics of changes in key metrics, in the form of a graph, and report built, using grouping by time with filters.
This feature allows users to see changes in traffic, clicks, conversions, and other metrics over specific time, day, month, or hour. The function is useful for analyzing the effectiveness of advertising campaigns, identifying abnormal fluctuations, and the general trend in the development of advertising projects.
By exploring data in Trends tab, the users can make more informed decisions about marketing strategies and optimize advertising efforts.
# 1. Grouping
Grouping in Trends tab in Keitaro allows you to collect the traffic data over specific time intervals for convenient analysis and tracking changes.
Grouping options:
Months. Shows overall traffic trends by month.
Weekdays. Helps to understand the traffic changes on different days of the week.
Days. Allows you to analyze traffic changes on individual days.
Hours. Shows the peak hours of user activity during the day.
# 2. Filters
Filters are used to selectively analyze traffic data, according to the certain criteria, or conditions.
Contains. Searches for a specified value in a report line.
Not contain. Checks if the specified value does not exist in the report line.
Equals. The strict compliance of the specified parameter in the report line is checked.
Not equal. The strict inequality of the specified parameter in the report line is checked.
Match regexp, Not match regexp. The ability to set a regular expression as a searched, excluded value.
Starts with. Finds matches with a given value from the first line of the report.
Ends with. Finds matches with the specified report line ending value.
Has label Search for matches based on the selected black / white lists label.
Has no label Search for inconsistency based on the selected black / white lists label.
# 3. Date interval
Select a report time interval.
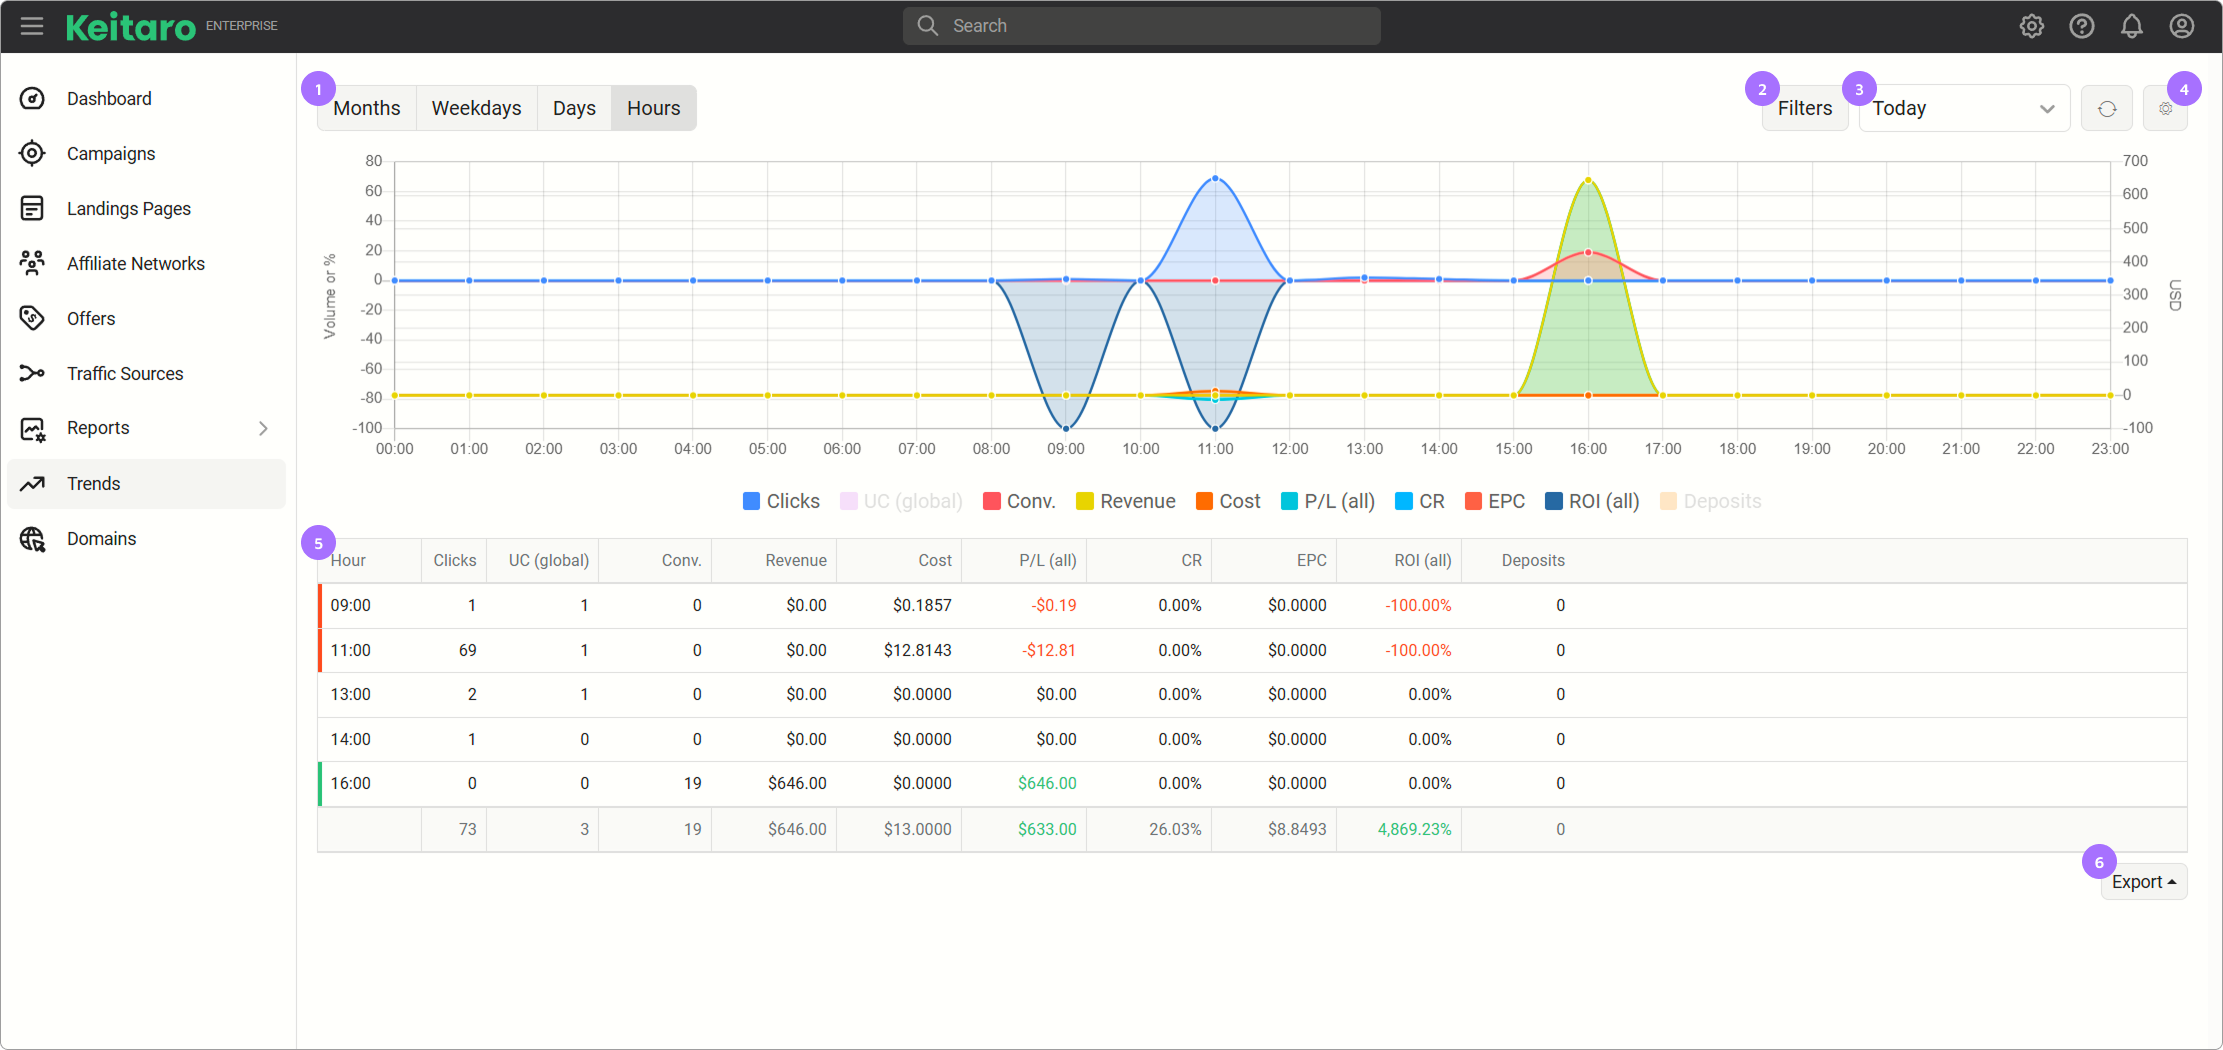
# 4. Metrics
Select the main metrics to display in the report. The selected metrics are displayed in separate colors — turn on or turn off the displaying of metrics on the chart as needed.
# 5. Report
The clicks report in tabular form duplicates the chart information.
# 6. Export
The ability to export a report to CSV or HTML.