# Logs
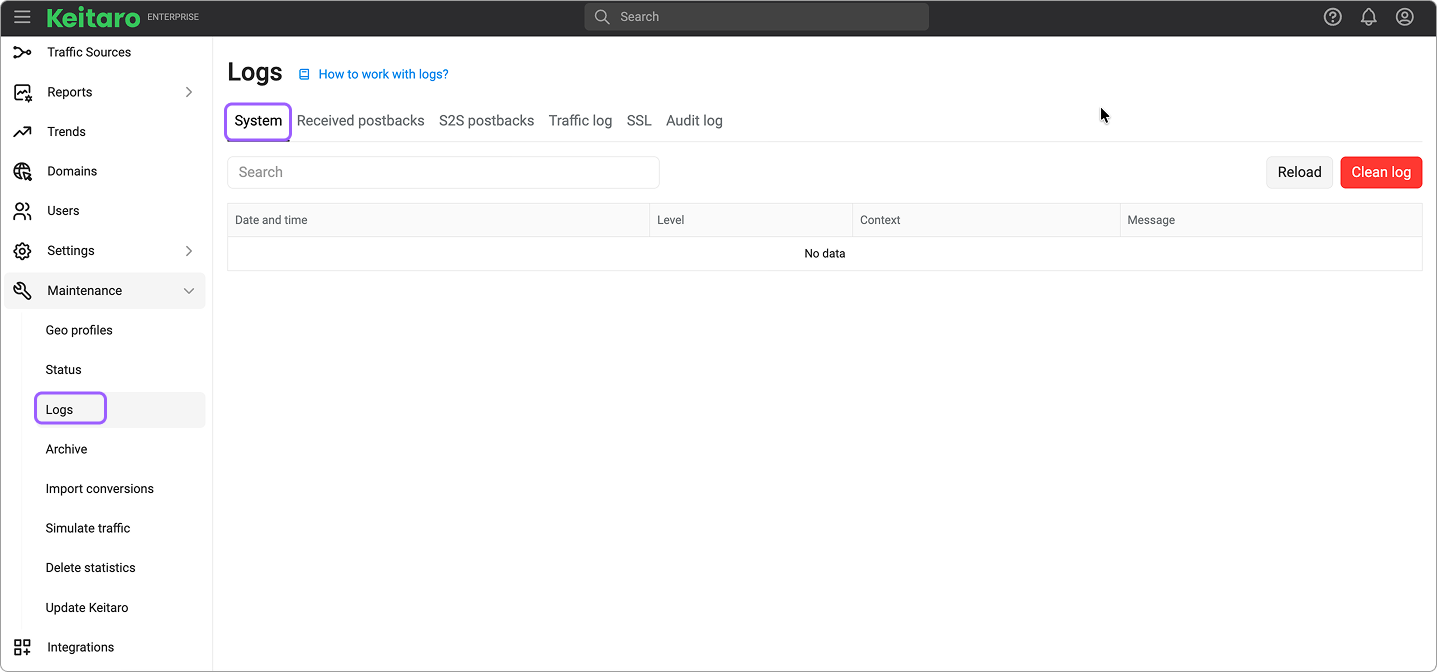
# System log
Maintenance → Logs → System
Tracker warnings and errors are included in this log.
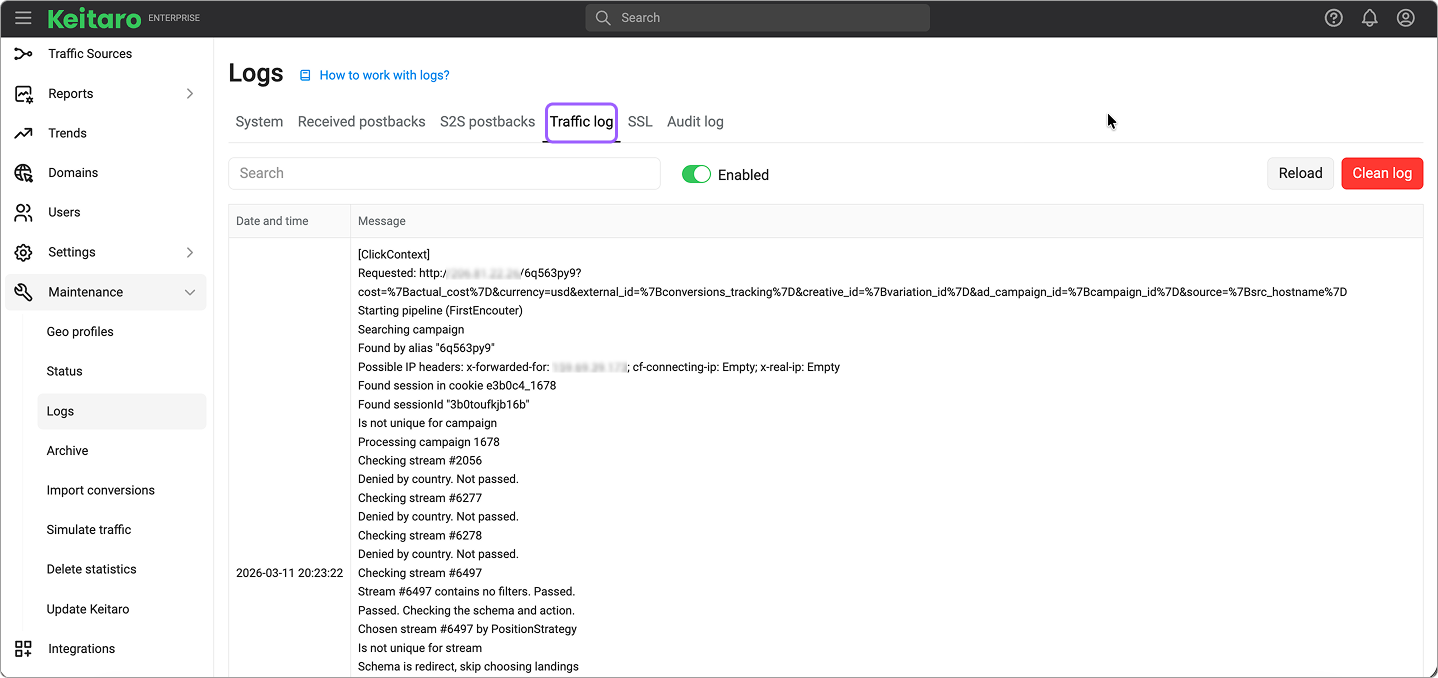
# Traffic log
The log contains information about the incoming traffic (clicks).
There are two traffic logs in the tracker:
- Global. Shows a log for all incoming clicks to the tracker and is located in the Maintenance → Logs → Traffic log menu.
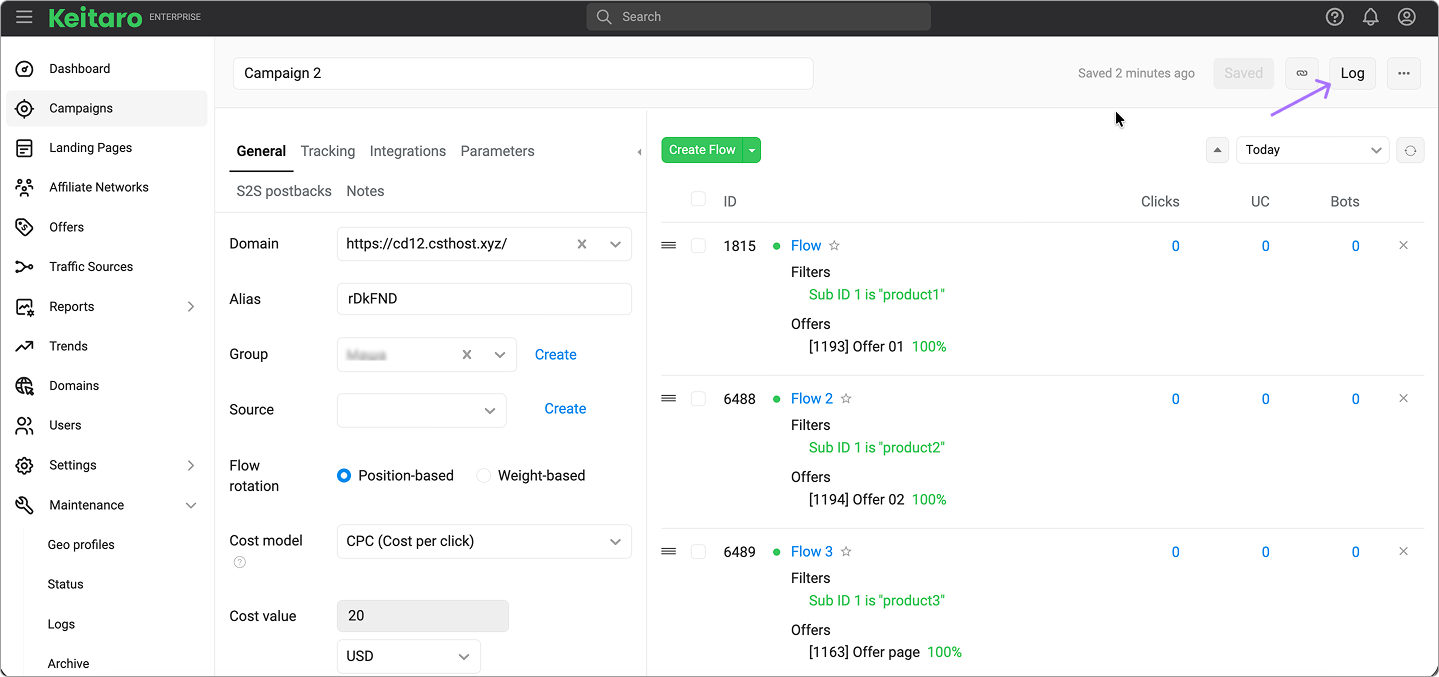
- Local log. Displays information especially for a campaign. This log is located in the campaign itself → the Log button above the flows.
# Log description
- Starting pipeline. The beginning of the click's path.
- Possible IP headers display potential click headers and corresponding IP addresses. The IPs may differ when the visitor uses proxy or VPN.
- Requested will show a URL which launched the campaign. Here you can also see which parameters were substituted into the link in the advertising network, and which of them came empty.
- Param alias matched describes which parameters have been substituted and in what report you can find them.
- Searching campaign. Keitaro identifies the campaign to execute based on the requested URL.
- Processing campaign shows the ID of the launched campaign.
- Checking flow. Shows which flow is being checked now, the tracker determines with filters whether a click can go to this flow or not. The flow ID (number) can be found by hovering the cursor over the flow's name or by collapsing the campaign settings on the right.
- All filters are checked indicates that all filters have been passed, and the click will remain on the flow. The flow number will be indicated in the Checking flow line.
- Blocks by filter “bot”. Not passed. shows that the click did not pass the Bot filter. The filter name can be different depending on which one you are using. If the click does not get to the first flow, it goes to the next one, and filters are checked again until the click is on the allowed flow.
- Passed. Checking the schema and action. The click goes to the flow. In this part, the tracker checks what settings are in the Schema tab, and what needs to be done with a click in this flow – either to show a landing page, an offer, or perform a redirect or some other action.
- Incoming headers array. List of cookies that came with the click. This is technical information showing which cookies are present in the request.
- Outgoing headers array. Cookies that Keitaro sends to the user to save or update data in the browser.
- Saving clicks. The number of clicks saved in the database.
- Pipeline execution time. How much time was taken to process this click.
- User info. In this part you can see all the information that Keitaro received from the browser about the click – subid, IP, UserAgent, language, country, city, region, browser, connection type, etc.
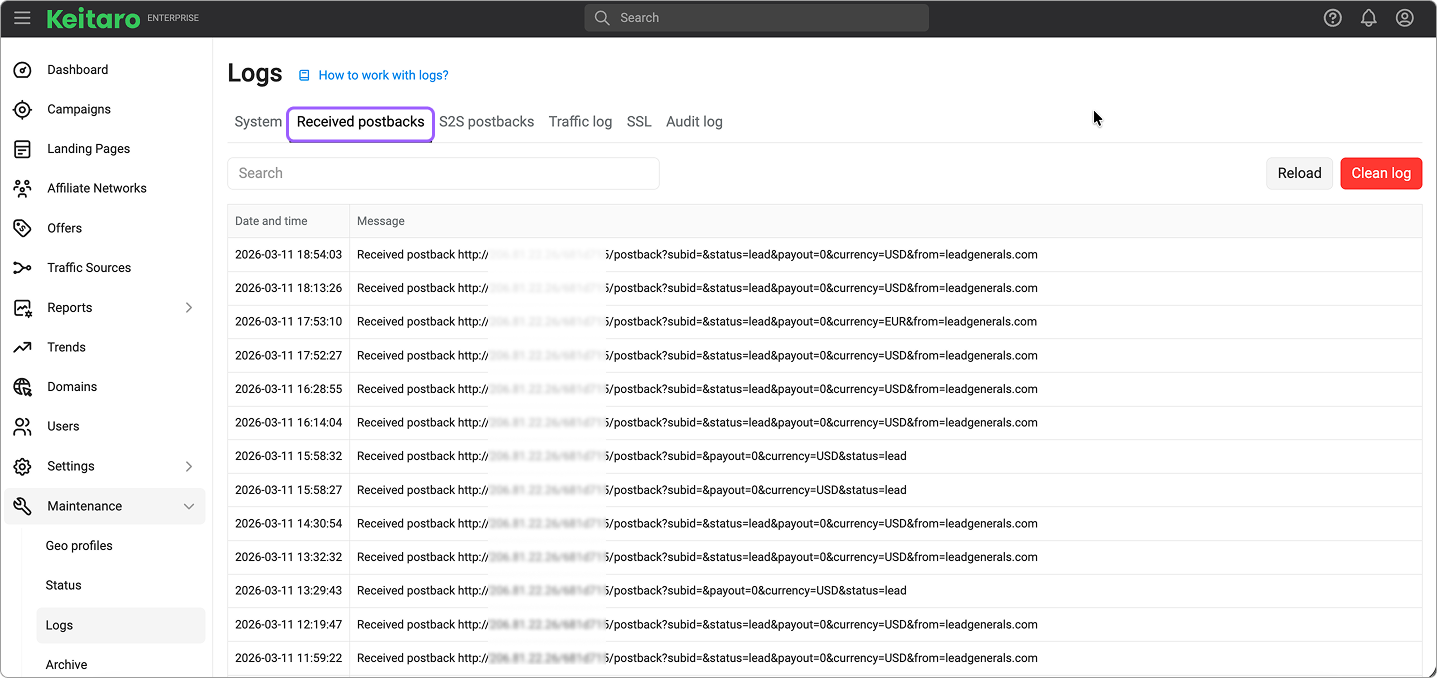
# Postback log
This log contains information about the postbacks received by Keitaro and how they were processed.
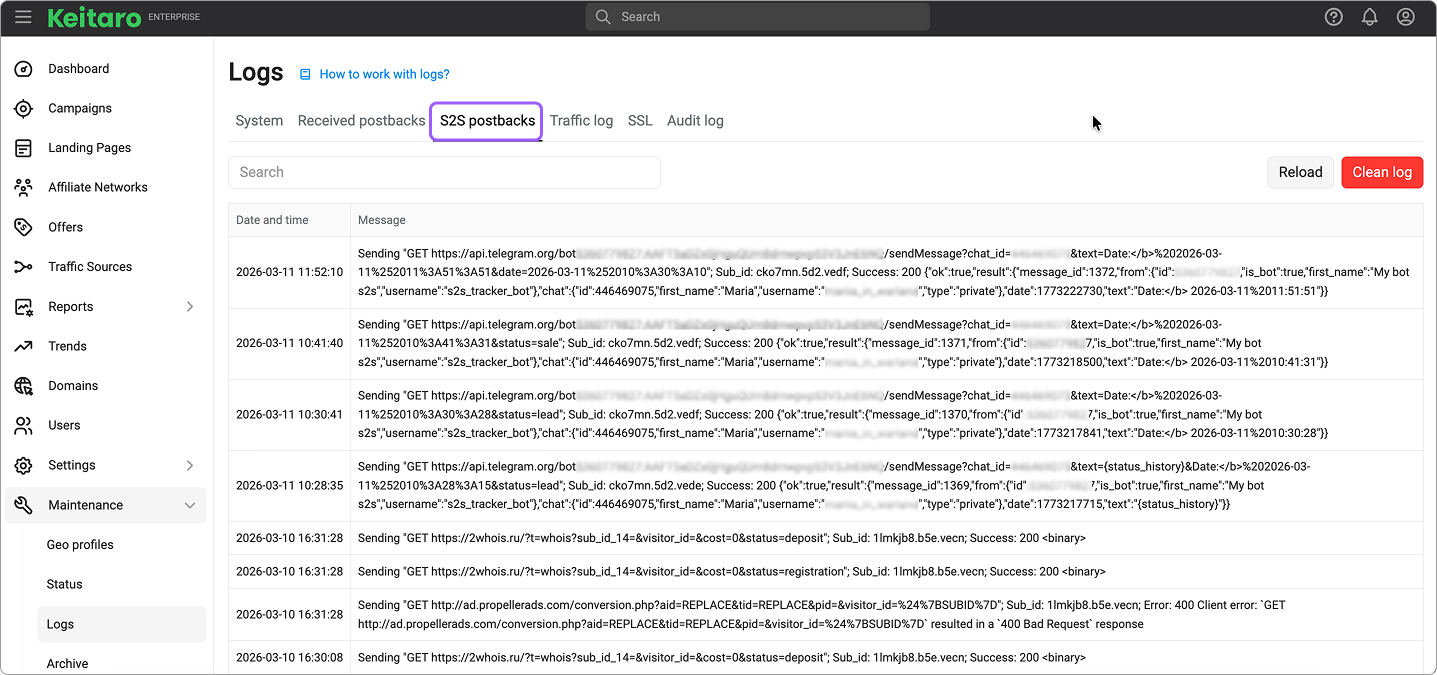
# S2S postback log
This log contains information about the S2S postbacks sent by Keitaro.
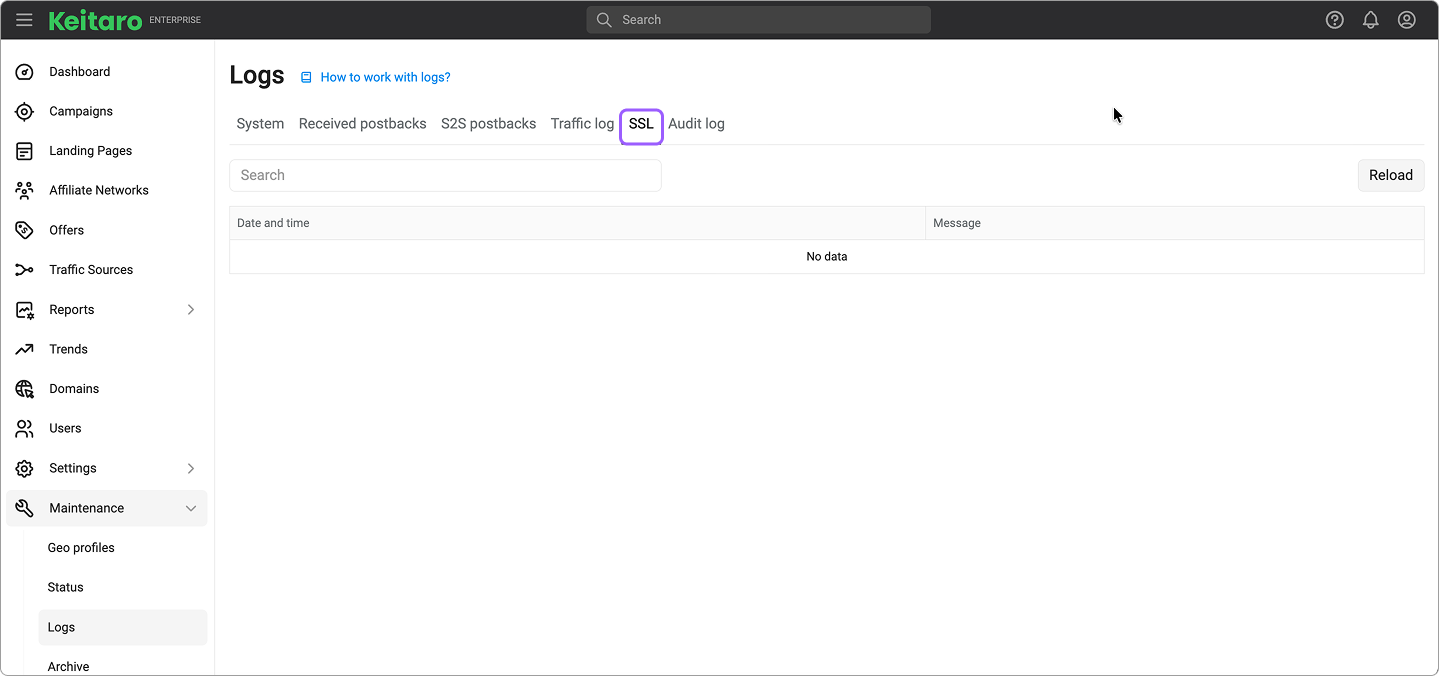
# SSL
The log contains the information about issuing SSL certificates.
# Audit log
The log of actions that were made with tracker's resources. All create, update, or delete actions with the tracker resources are written there. Actions are written with their GET and POST parameters.
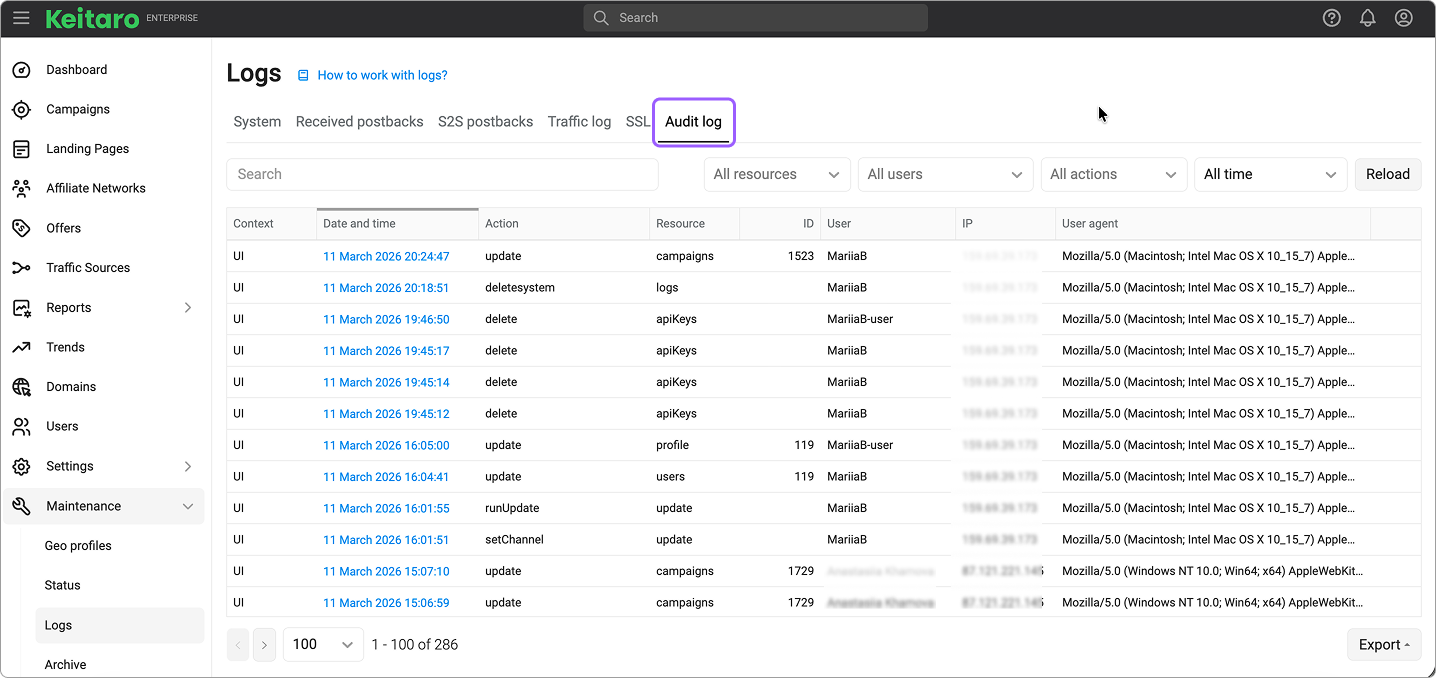
With the help of Payload filter, you can find records by their body, GET, or POST parameters. Also, you can filter records by:
- Resource
- Action
- Date and time
Audit log can be exported to CSV and HTML formats. Also, you can query audit log with Admin API.
Available only for admins in team and enterprise editions.
Table columns:
- Context: shows from what context the request were made (UI or Admin API).
- Date and time: on clicking, the window appears, that contains request details. There you can see all request parameters.
- Action: what was made with resource.
- Resource: what tracker resource was affected.
- ID: if some resource was created, updated, or removed, you can see its identifier.
- User: the user performing the action in a tracker.
- IP: which IP address request originated from.
- UserAgent: user agent of browser request originated from.
- Response code: the HTTP status code of the tracker's response. It shows whether request was successful (respond 200), or unsuccessful (respond 400, 500).