# Dashboard
The dashboard is the main graphical interface designed to display key financial indicators and metrics for tracking advertising campaigns and traffic analysis in Keitaro.
Video
The Dashboard tab displays customizable indicators, such as the quantity of visitors, number of transitions, conversions, profit, and other metrics in real time or over a certain time frame.
It provides users a quick overview of the current state of advertising campaigns, allowing them to easily track, and control key productivity aspects without the need to manually analyze much data.
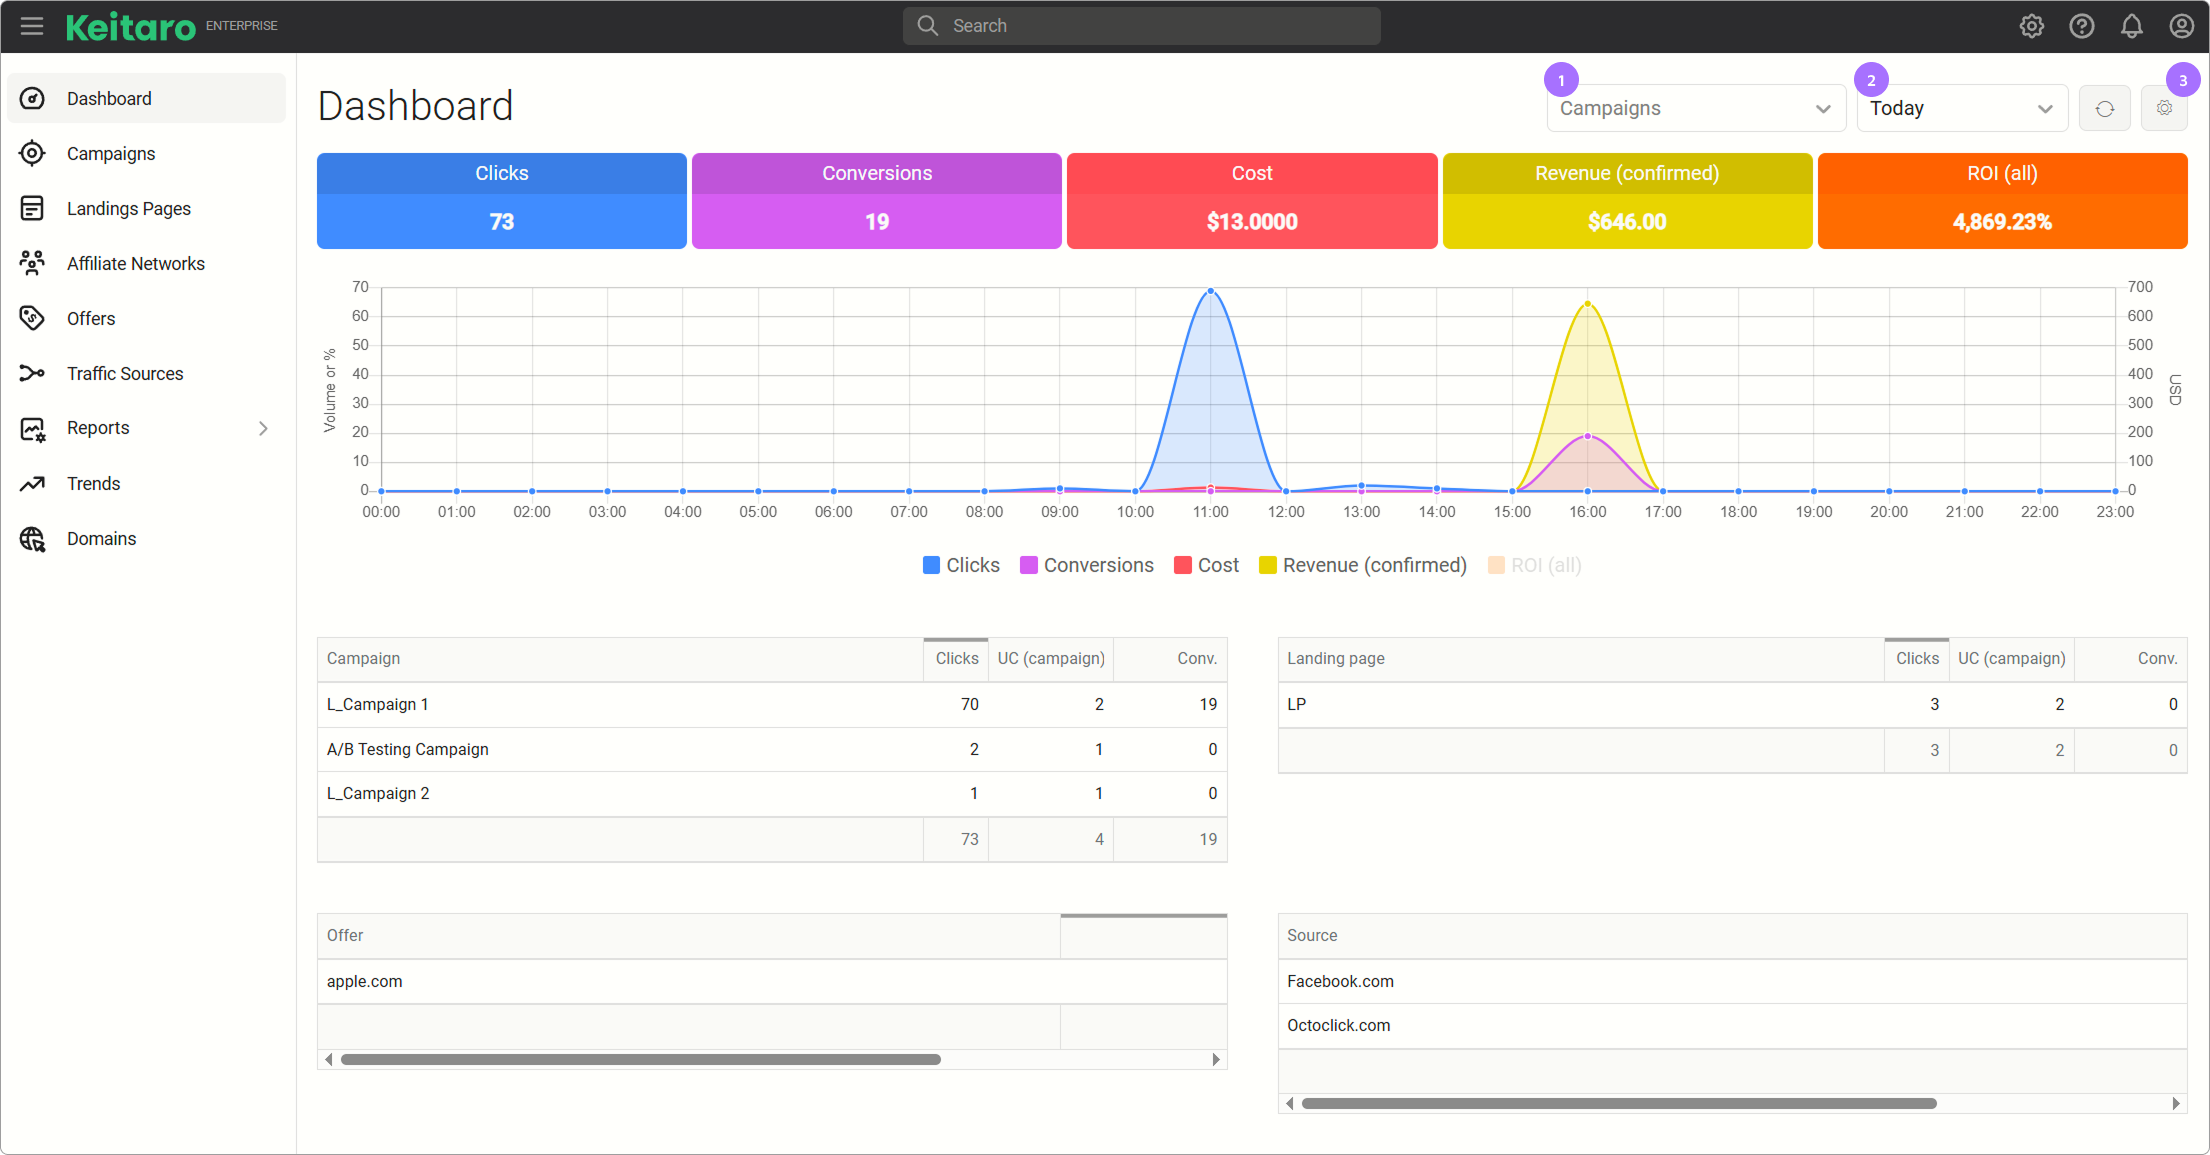
The graph is based on campaigns. You can filter by a specific campaign or display a report on campaigns as a whole.
Filter by time interval.
Metrics setup. Display of key indicators for analyzing campaign performance: number of clicks, conversions, expenses, revenues, ROI, CR and other parameters.
# Metrics setup
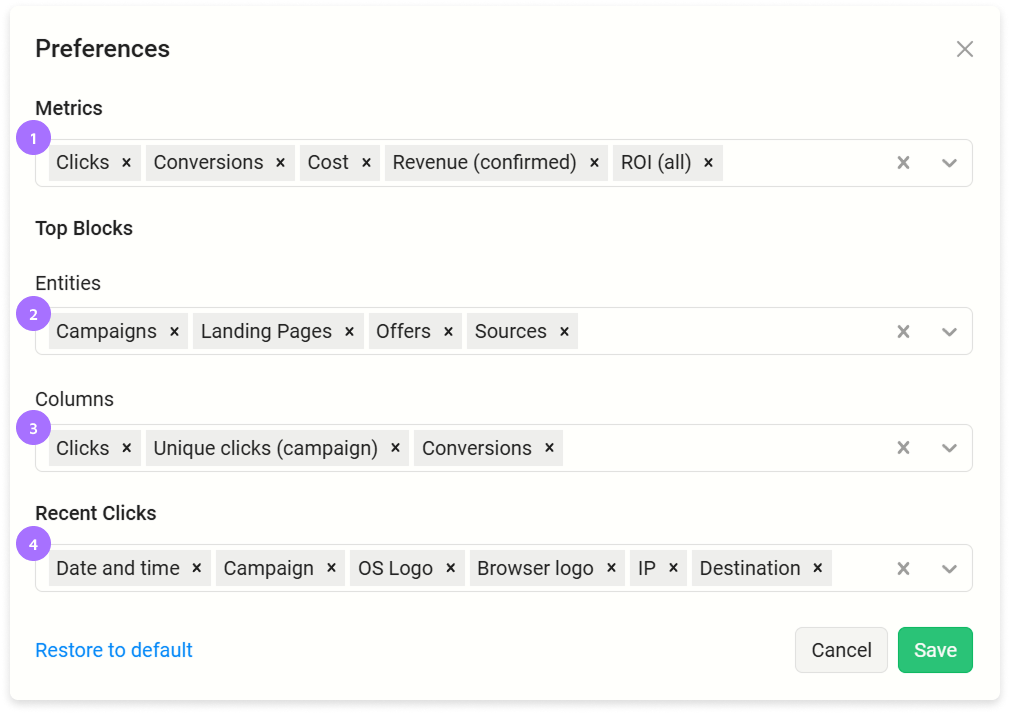
The display of key metrics for the chart is selected separately menu under the Metrics heading in settings.
It is possible to individually configure blocks, which will be displayed as mini—reports under the Dashboard graph.
The choice of metrics is set in the same form for all Dashboard blocks.
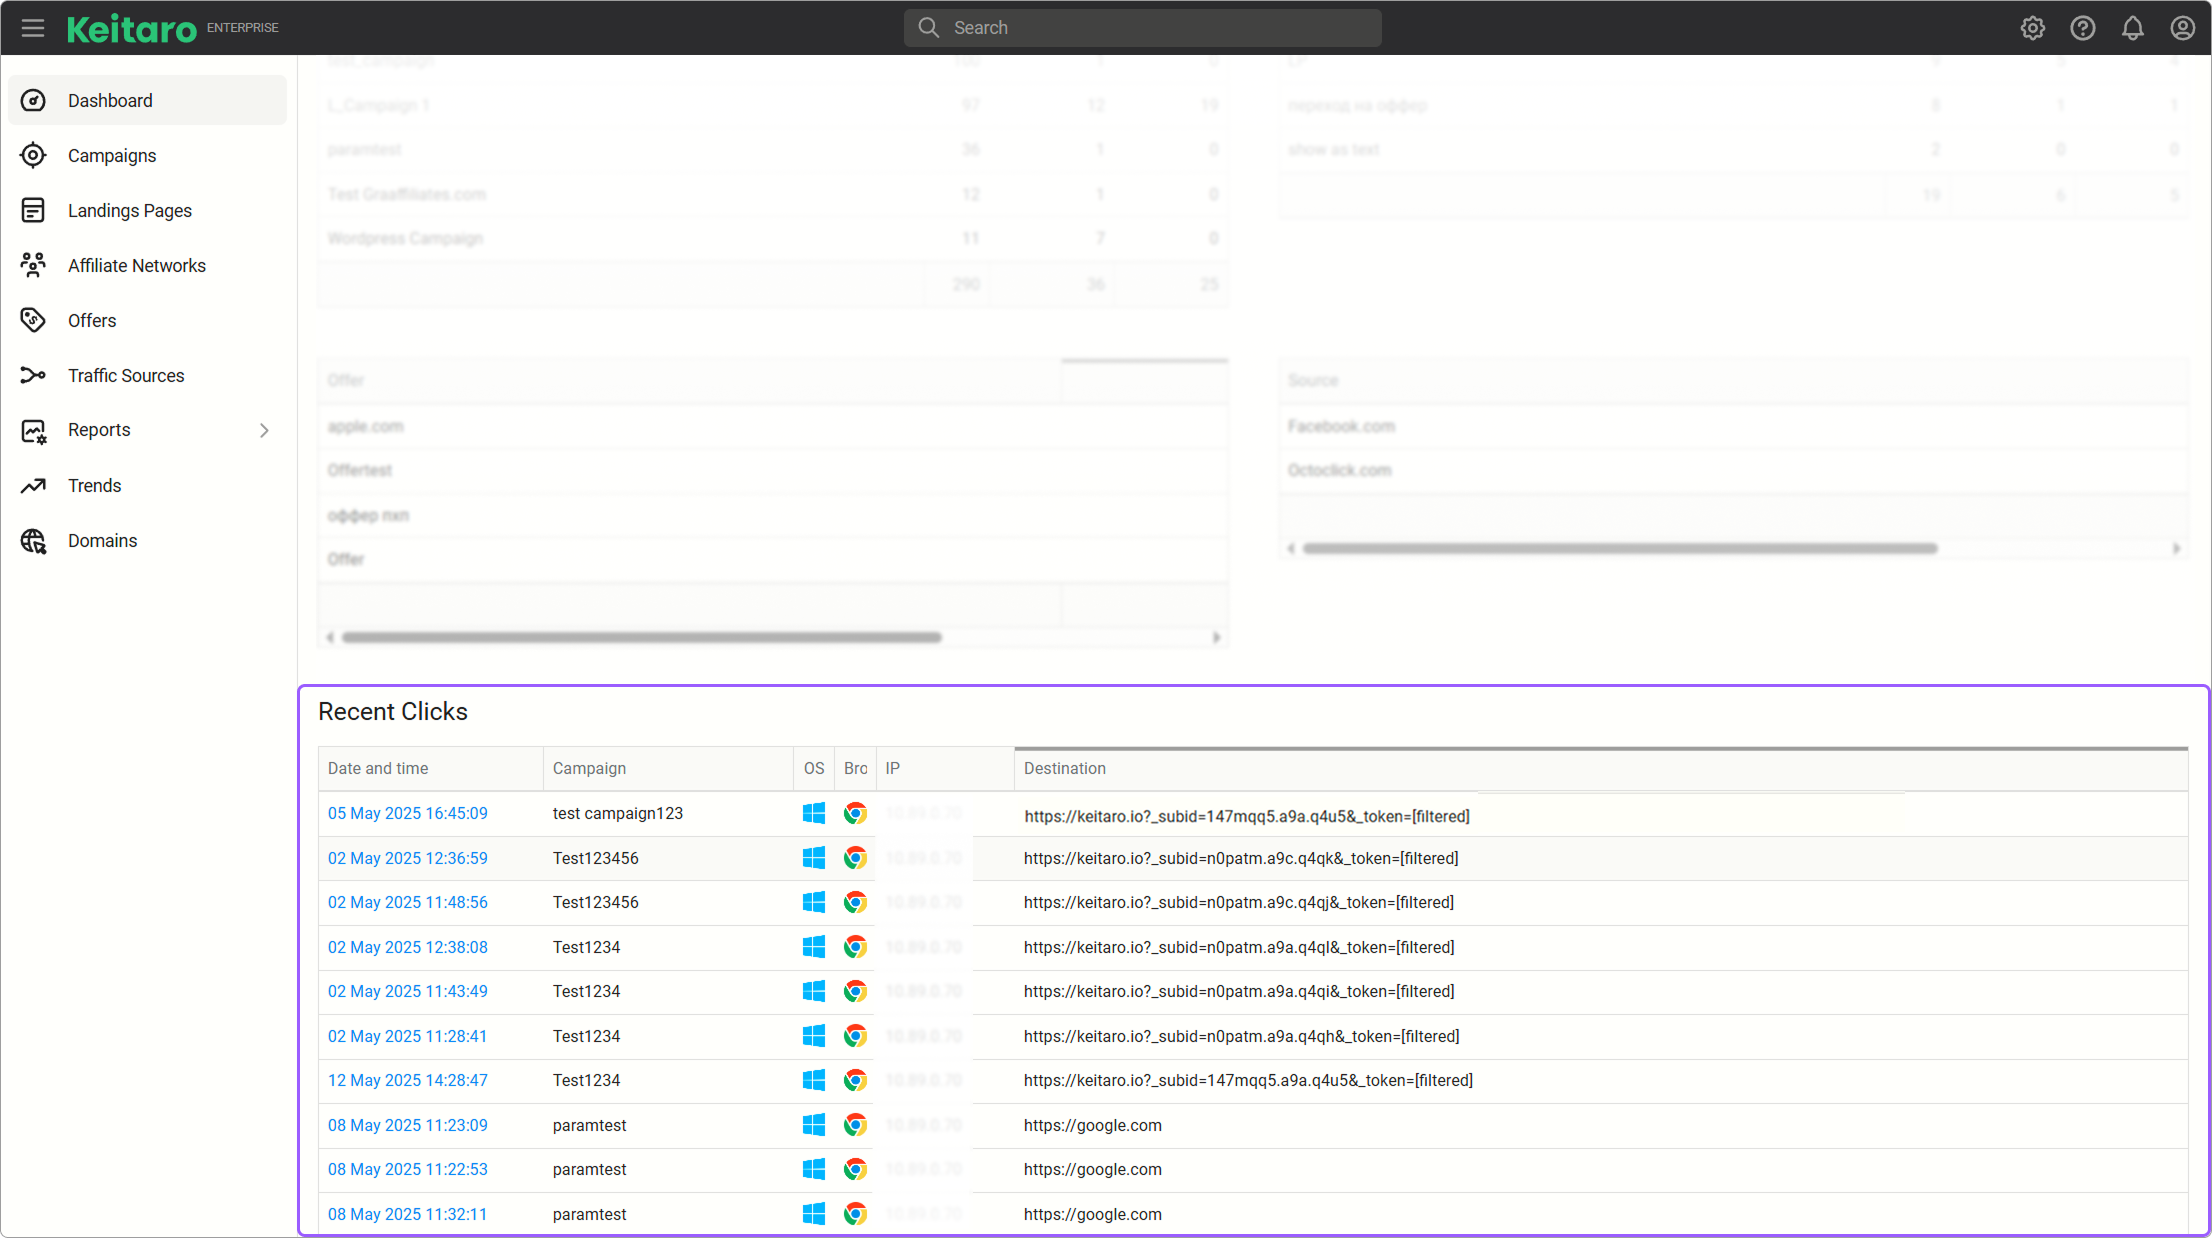
Metrics that will be displayed for the last 10 clicks in the tracker are in the Recent Clicks block.
# Dashboard report features
When using the Report display conversion date — Click function and working according to the scheme in the Send to campaign flow, the data in the report is displayed only for the parent campaign.
When using the Report display conversion date — Conversion function and working according to the scheme in the Send to campaign flow, the click data in the report is displayed only for the parent campaign, but the conversion data is also displayed for the child campaigns.