# Create report
The Reports → Create report section in Keitaro is one of the most powerful and flexible tools in the system. It allows you to create custom traffic reports, analyze campaign performance, and make decisions based on data.
A drill-down (tree) report function is available — this is a serious analytics upgrade, especially for those who work with complex traffic structures.
Reports with nested grouping levels, which are displayed as an expanding hierarchy, allow you to:
First, group data by source
Inside — see campaigns
Then — streams, offers, subid, geo, etc.
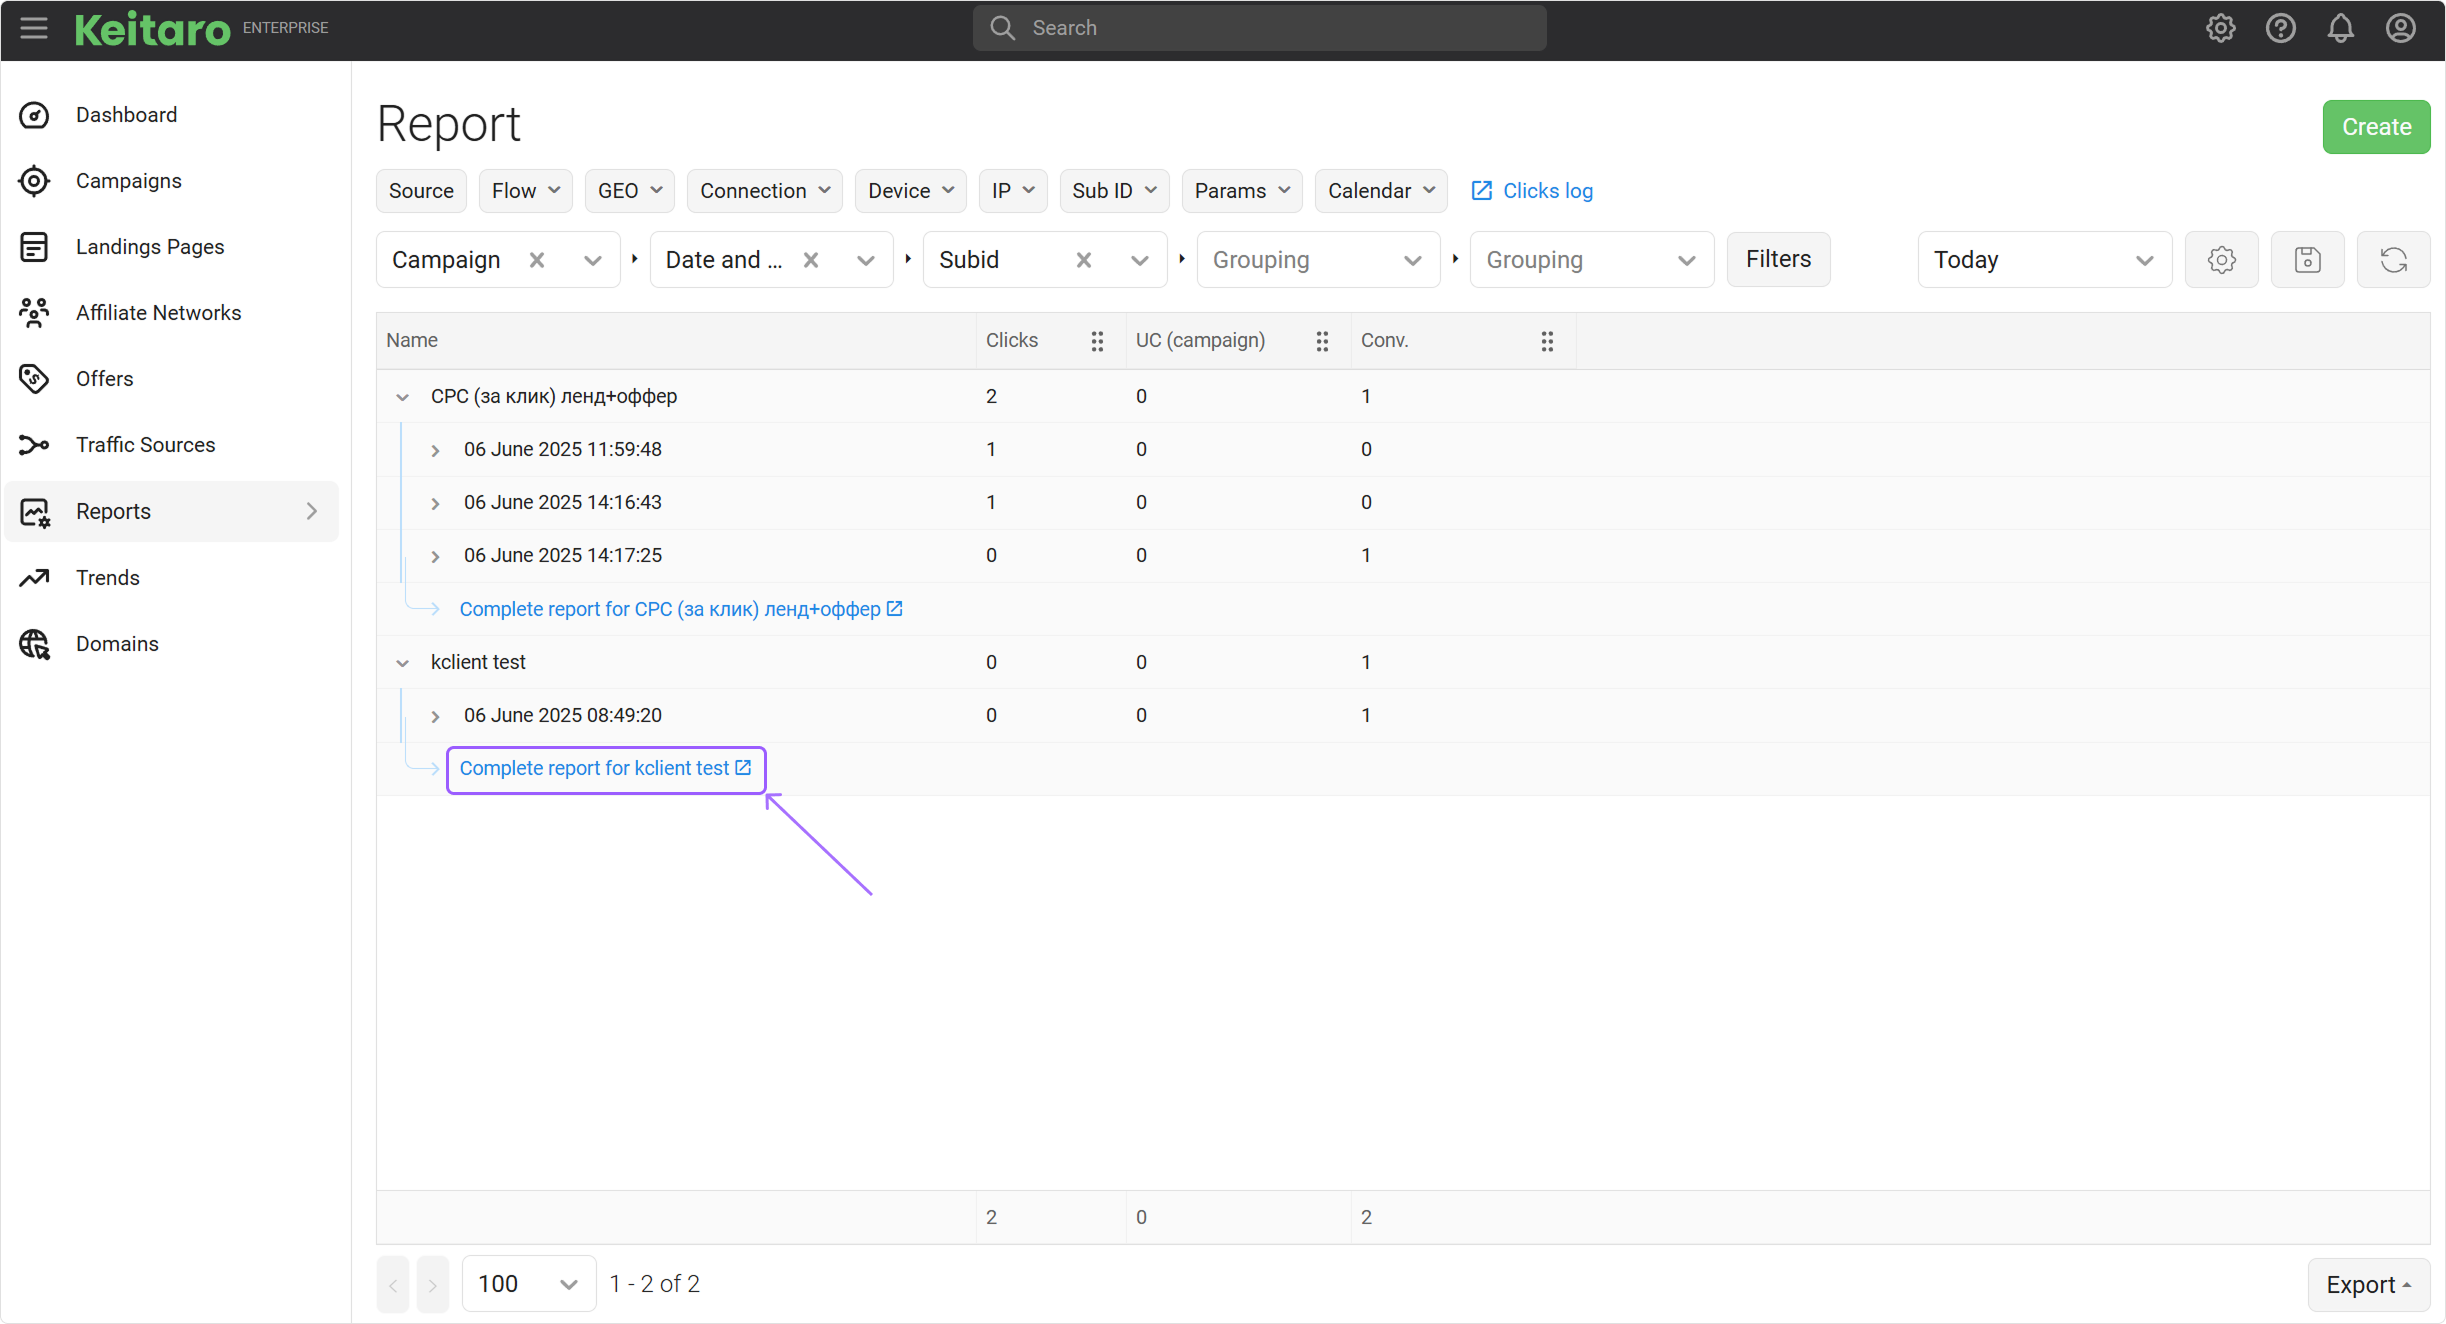
The report output implies 25 lines for each report stage. If there is more data, you need to open the full report for this grouping in a separate tab by clicking on Full report.
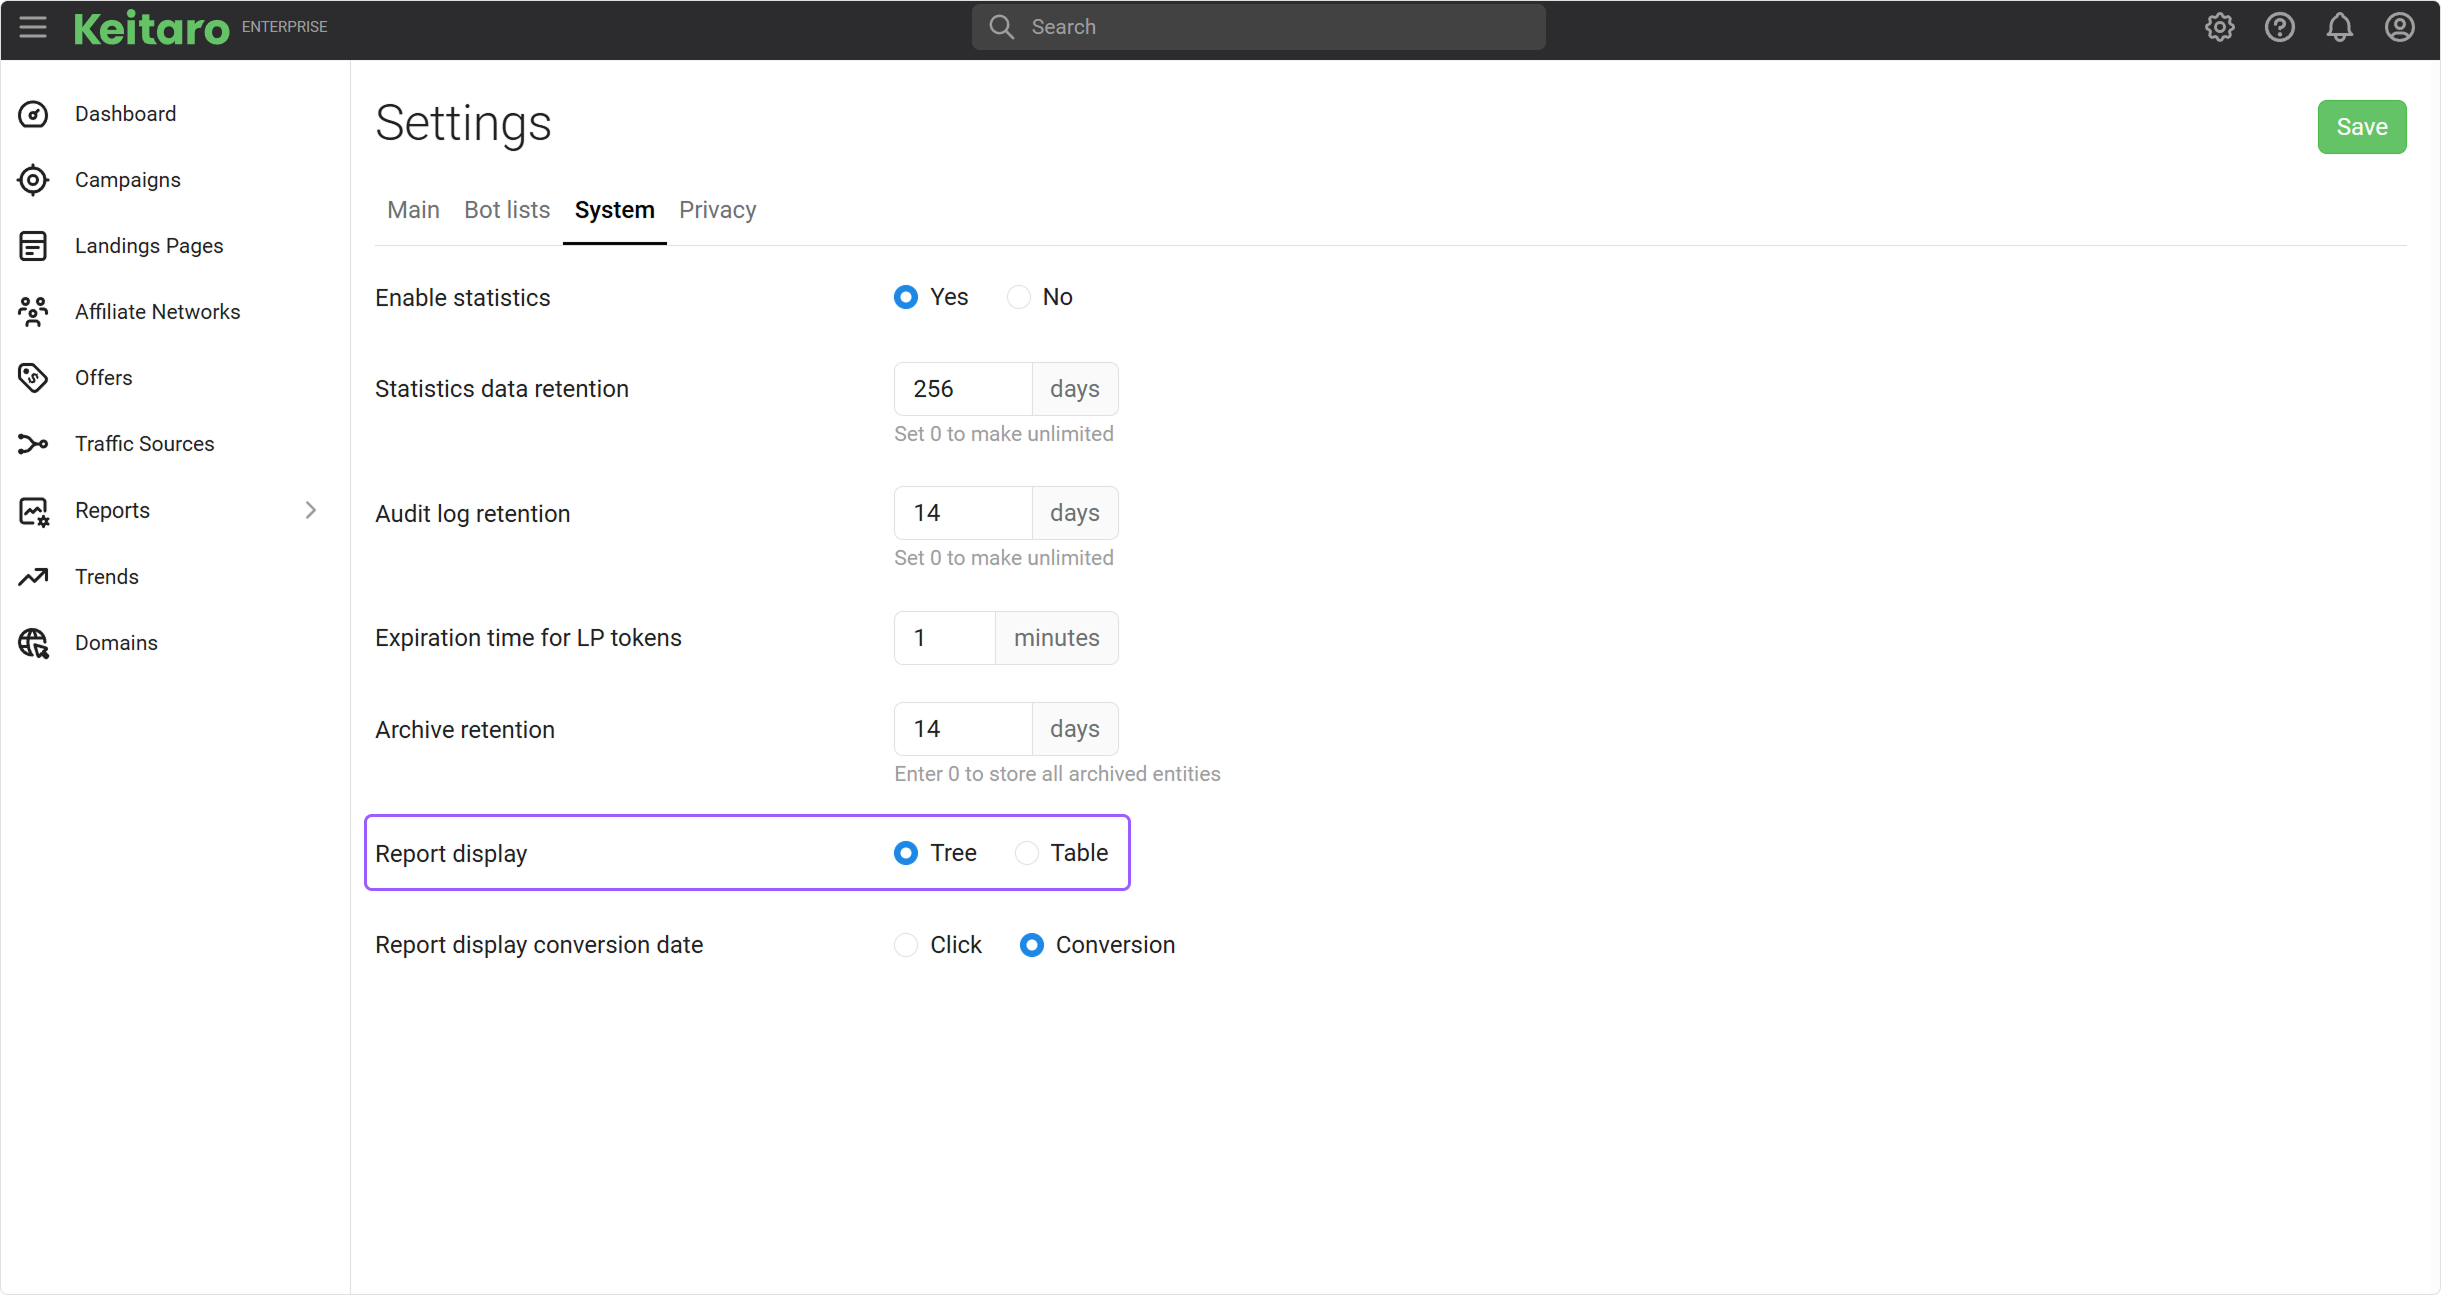
You can change the report type from tree to regular in the Settings — System — Report display section:
# 1. Quick access to groupings
# 2. Grouping
Adding the necessary columns to the report by which the data will be grouped.
# 3. Filters
Filters for displaying specific values in the report:
- Contains. Search for the specified value in the report line.
- Not contain. The absence of the specified value in the report line is checked.
- Equals. The strict compliance of the specified parameter in the report line is checked.
- Not equal. The strict inequality of the specified parameter in the report line is checked.
- Match regexp, No match regexp. The ability to set a regular expression as a searchable, excluded value.
- Starts with. Search for matches with the specified value from the beginning of the report line.
- Ends with Search for matches with the specified value from the ending of the report line.
# 4. Time interval
Select the time interval for which to display statistics.
# 5. Metrics
To add or remove columns, click the metrics management button.
# 6. Save report
Allows you to save report settings to return to it.
# 7. Refresh
Clicking the button will refresh the statistics.
# 8. Pagination
The number of log lines displayed on the page.
# 9. Export
Ability to export data to CSV or HTML.
# FAQ
How to change the sorting in a column?
Click on the column header to change the sorting.
How to change the currency in reports?
The storage currency is set on the Maintenance → Settings page. If you already have data in the database, then it will no longer be converted into new currency. The changes will only affect the new data.
How to update costs?
See How to update costs page.
Unable to upload a large report (csv, html), Timeout error.
The report is being created on the server for some time. View the list of uploaded reports on the page Reports → Exported Reports.
If the required report is not available and the tracker does not have time to collect it before the timeout, you need to reduce the number of columns in the report by removing unnecessary ones, or reduce the time selection.
How to provide access guest access to the report?
Create a new user and provide access to the campaign and report.
How to change the order of columns in reports?
Click the gear button and drag the metric names into the desired order.
Why reports do not include upsells in conversions column?
It is made to prevent calculating the incorrect CR (Conversion Rate). You can add column, metric "Up-sells" to your reports.