# Status
Keitaro is a self-hosted product and is installed on the client's server. The tracker has a functionality for monitoring the technical condition, including information about the installation, build version, engine version, and other indicators that evaluate the health of a particular tracker.
Located on the Maintenance → Status tab.
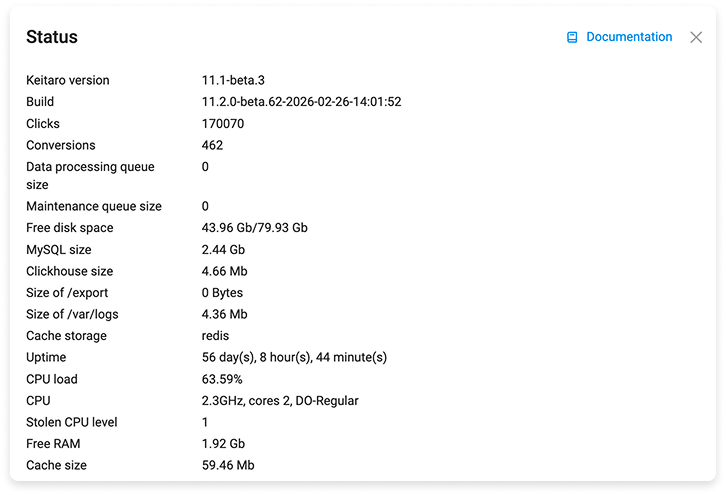
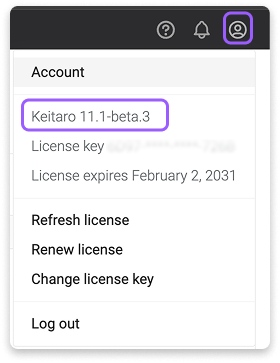
# Keitaro version
Keitaro version 11.1-beta.3 — shows the current version of the tracker. Displayed in the account:
Earlier version of Keitaro includes the possibility that the tracker is running on an outdated server configuration, does not include the latest hardware optimization settings or various package modules that will help to implement the full functionality of the tracker. Switching to the beta version contains new functionality, but also the possibility of new bugs.
Check with our support for the latest version of the installer and, if necessary, request an update.
# Build
Version and release time, information for developers, for debugging.
# Clicks
The total number of clicks in the tracker for now.
# Conversions
The total number of conversions in the tracker for now.
# Data processing queue size
The number of commands that the tracker has not processed yet. In the case when traffic volumes exceed the recommended characteristics for hardware, the tracker does not have time to process all requests and puts it in a virtual queue which it processes as resources become available. Data includes clicks and conversions.
# Maintenance queue size
The number of system commands that the tracker has not yet processed, such as: migrations, deleting a large archive, importing conversions, mass cleaning data (statistics), updating costs.
# Cron timestamp
The start time of cron, used for processing commands. Runs automatically once a minute. If cron has not been started for a long time, there is an error in the tracker's admin panel (yellow triangle with a notification about non-working cron). The tracker is not processing traffic and the state is considered completely unhealthy.
# Free disk space
The amount of free disk space. The indicator is updated automatically once a minute.
# MySQL / Clickhouse size
The database includes the tracker statistics: a list of all created resources and settings, information about clicks with conversions, and tracker settings. Local landings are not included in the Database.
# Size of /export
The directory stores reports that are exported from the tracker.
# Size of /var/logs
The size of the directory where tracker logs are stored (Maintenance → Logs). It has an automatic cleaning and overwriting with new data when the maximum log size is reached. The default value is 30Mb.
# Cache storage
The cache stores everything that is in the interface: information about campaigns, flows, domains, offers, landing pages, etc.
# Using TokuDB
High performance open source storage engine for MySQL and MariaDB.
# Uptime
Server and components uptime. In other words, this is the time the server (hosting) was running before stopping, which does not depend on the reasons (for example, reboot, shutdown, app termination, etc.).
# CPU load
The current processor load of the server. Normal loading is at most 100%.
# CPU
Server processor data.
# Stolen CPU level
The amount of time the virtual server waits for processor resources from the hypervisor. The optimal value is 0.
# Free RAM
The amount of free RAM memory.
# Cache size
Cache size. More information in the section Cache Storage.
← Geo profiles Logs →